How to use VWAP Indicator for Intraday Trading

How to use VWAP Indicator for Intraday Trading

The Volume Weighted Average Price (VWAP) is a vital tool for traders, especially in intraday trading, where precision and timing are critical. This blog dives deep into VWAP strategies, empowering learners with actionable insights to achieve consistent profits in the stock market.

Trading requires a blend of patience, skill, and the right strategies. With VWAP, you can analyze price trends and volume dynamics, enabling better decision-making during volatile trading sessions.

Table of Contents

  1. Understanding Market Structure
  2. What is VWAP?
  3. Formula
  4. Intraday Bullish VWAP Strategy
  5. Intraday Bearish VWAP Strategy
  6. Limitations of VWAP
  7. What Does VWAP Tell You?
  8. Conclusion
  9. Frequently Asked Questions (FAQs)

Understanding Market Structure

The stock market operates in distinct cycles, often categorized into four stages:

The stock market operates in distinct cycles, often categorized into four stages:

Stage 1: Accumulation Phase

This phase occurs after a market decline. Prices stabilize and move sideways as buyers regain control. Traders may consider long positions during this phase, but trend traders often prefer to wait for more precise signals.

Stage 2: Uptrend (Markup Phase)

A strong upward trend follows the accumulation phase. According to Charles Dow's principles, once a trend is established, it is more likely to continue than reverse. This stage is ideal for traders looking to capitalize on upward momentum.

Stage 3: Distribution Phase

After the uptrend, the market consolidates and moves sideways again. This phase signals potential reversals, requiring traders to be cautious.

Stage 4: Downtrend (Markdown Phase)

The market enters a decline, making short positions more profitable. Intraday traders often focus on this phase to exploit bearish opportunities.

What is VWAP?

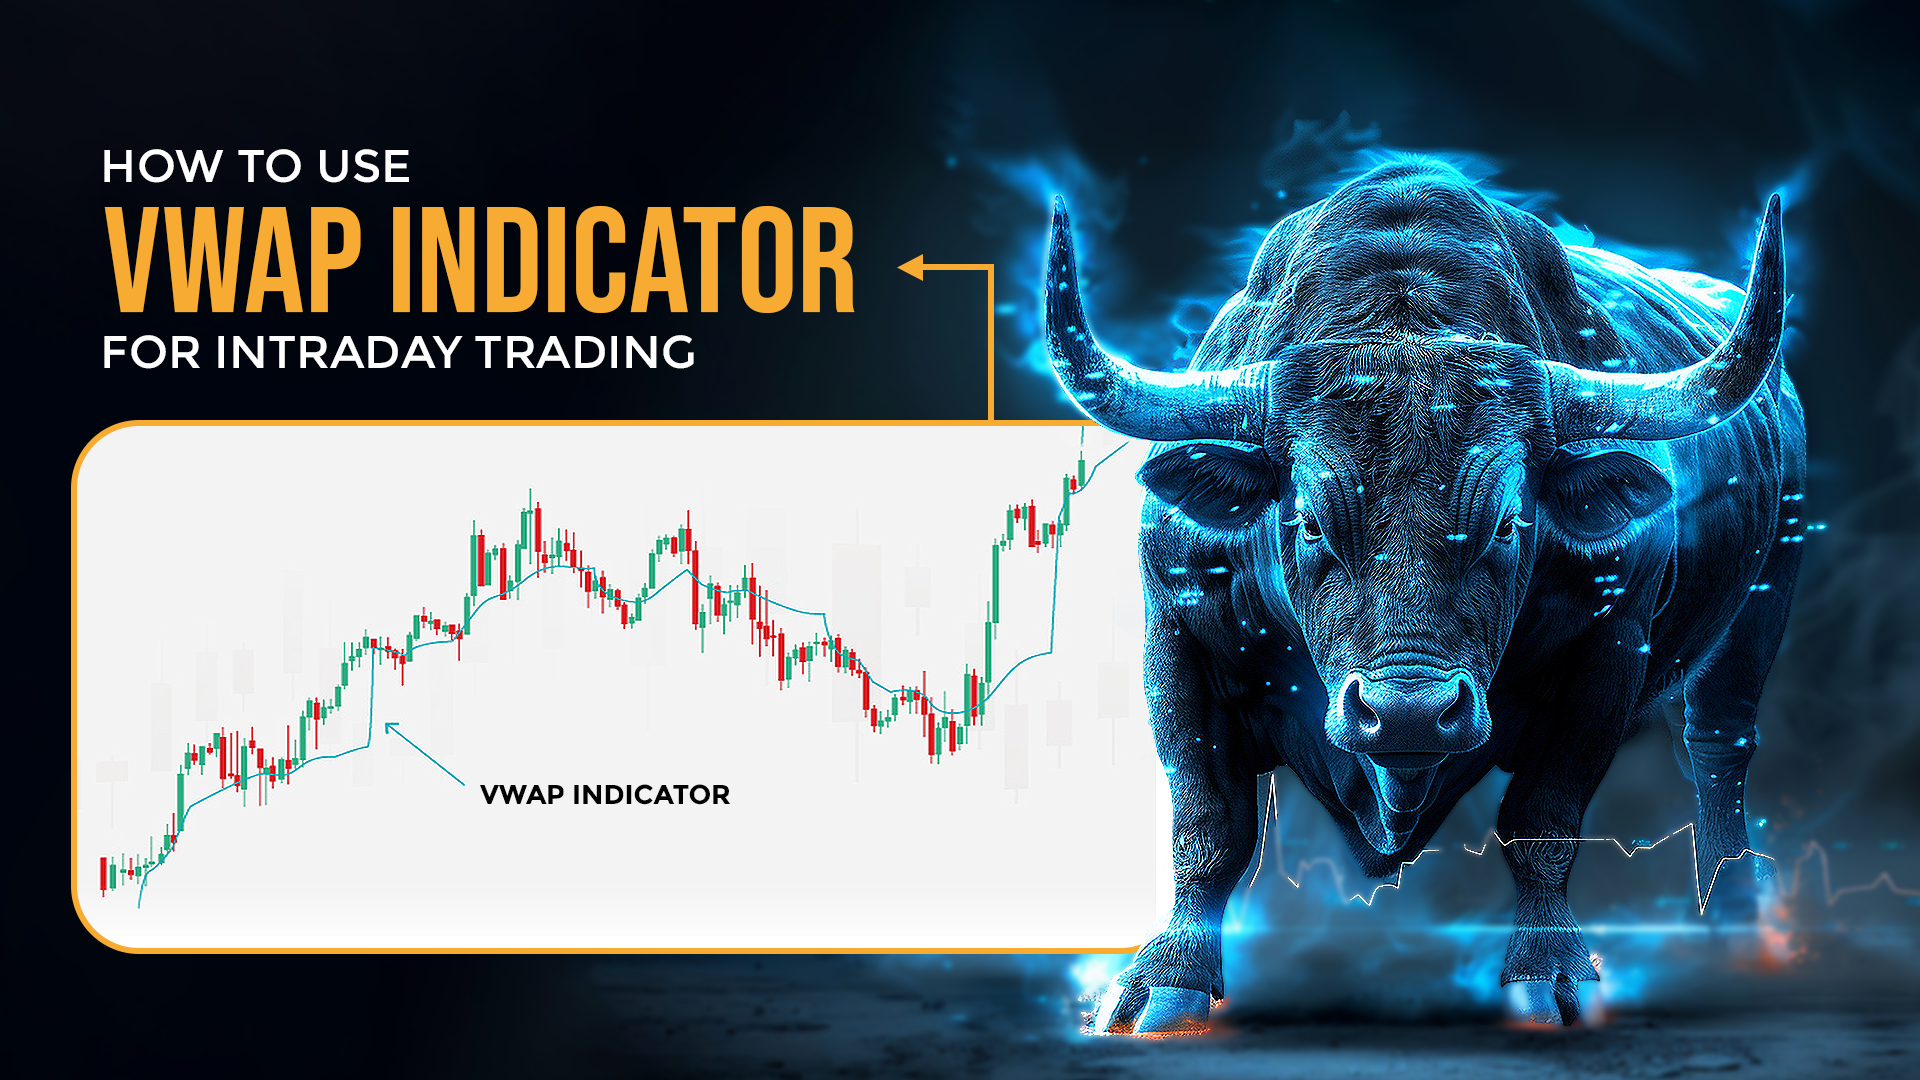
The Volume Weighted Average Price (VWAP) combines price, Volume, and time to provide an average trading price throughout the day. Unlike simple averages, VWAP weighs prices by trading volume, making it a more accurate reflection of a stock's actual value.

Why is VWAP Important?

  1. Trend Analysis: It helps traders identify bullish or bearish trends.
  2. Liquidity Insights: Provides information about market liquidity.
  3. Entry and Exit Points: Guides traders on optimal price levels for entering or exiting trades.

Key Market Phases and VWAP

  1. Uptrend: Prices rise when demand exceeds supply.
  2. Accumulation: Sideways movement occurs before a breakout or continuation.
  3. Downtrend: Prices decline due to reduced demand.

Formula

The formula for VWAP is:

VWAP=Cumulative Typical Price×VolumeCumulative VolumeVWAP = \frac{\text{Cumulative Typical Price} \times \text{Volume}}{\text{Cumulative Volume}}VWAP=Cumulative VolumeCumulative Typical Price×Volume

Where:

  1. Typical Price = High Price+Low Price+Closing Price3\frac{\text{High Price} + \text{Low Price} + \text{Closing Price}}{3}3High Price+Low Price+Closing Price
  2. Cumulative Volume = Total Volume traded since the session opened

This calculation ensures that VWAP reflects both price movement and trading activity accurately.

Intraday Bullish VWAP Strategy

In an intraday scenario, traders can leverage VWAP to identify bullish opportunities.

In an intraday scenario, traders can leverage VWAP to identify bullish opportunities.

  1. Buy Signal: If the stock price is trading above a rising VWAP, it indicates strong buying interest. Avoid short positions in this scenario.
  2. Confirmation: Look for a breakout above the trading range with volume support.
  3. Stop Loss: Place a stop loss below the VWAP level to limit risks.

This strategy helps traders capitalize on upward momentum, particularly during volatile sessions.

Intraday Bearish VWAP Strategy

Intraday Bearish VWAP Strategy

For declining markets, the bearish VWAP strategy offers profitable opportunities:

  1. Sell Signal: If the stock price is trading below a falling VWAP, it indicates bearish momentum.
  2. Confirmation: Monitor for breakdowns with increasing Volume.
  3. Stop Loss: Position your stop loss slightly above the VWAP level to protect against sudden reversals.

This approach is especially effective during market downtrends or in weak economic conditions.

Limitations of VWAP

While VWAP is a powerful tool, it has its limitations:

  1. Daily Reset: At the beginning of each trading day the VWAP resets. Averaging VWAP over multiple days can distort accuracy.
  2. Lagging Indicator: Since VWAP is based on historical data, it lacks predictive power, especially during fast-moving markets.
  3. Missed Opportunities: In strong uptrends, prices can rise consistently above VWAP, causing traders to miss profitable trades while waiting for a dip.

Despite these drawbacks, VWAP remains a valuable tool when combined with other technical indicators.

What Does VWAP Tell You?

VWAP, or Volume Weighted Average Price, is a crucial metric in trading that offers valuable insights into several key aspects of market behavior:

  1. Liquidity: VWAP provides a comprehensive view of the average price at which a security has traded throughout the day, weighted by the volume of trades at each price level. This reflects the point where buyers and sellers are most active, allowing traders to gauge the liquidity of the asset. A higher volume near the VWAP suggests stronger liquidity, indicating that traders can enter and exit positions more easily without significantly impacting the price.
  1. Fair Value: By comparing the current price of a stock to its VWAP, traders can assess whether the stock is overvalued or undervalued based on its trading activity during the day. If the current price is significantly above the VWAP, it may be considered overvalued, suggesting that a potential correction could occur. Conversely, if it is below the VWAP, the stock may be undervalued, indicating a possible buying opportunity.
  1. Market Sentiment: VWAP also serves as a barometer for market sentiment, revealing prevailing bullish or bearish trends throughout the trading session. By analyzing how the price interacts with the VWAP, traders can identify shifts in sentiment. For example, if the price remains consistently above the VWAP, it may suggest a bullish trend, while consistent trades below the VWAP may indicate bearish sentiment for the asset. This can help traders make informed decisions about market direction and timing.

In outline, VWAP is not only a technical indicator but also a valuable tool for understanding market dynamics, enhancing trading strategies, and making informed decisions.

Conclusion

The Volume Weighted Average Price (VWAP) is an essential indicator for traders aiming to optimize their intraday strategies. By combining price and volume data, VWAP offers insights into market trends, liquidity, and fair value. Incorporating VWAP into your trading toolkit can enhance your ability to identify profitable entry and exit points. However, always use it alongside other tools for a well-rounded strategy.

Frequently Asked Questions (FAQs)

FAQ

Q1. Which indicator works best with VWAP?

VWAP works best with momentum indicators like MACD or stochastic oscillators.

Q2. What is the limitation of VWAP?

VWAP resets daily, making it unsuitable for long-term trend analysis.

Q3. Can VWAP be used for swing trading?

Yes, VWAP offers valuable insights intomarket trends for swing traders, optimizing entry and exit points.

Q4. How accurate is the VWAP trading strategy?

VWAP provides a more accurate representation of a stock's average price compared to simple moving averages.

Q5. When is VWAP most effective?

VWAP is most effective in intraday trading due to its daily reset feature.

Filter by Category
    Search