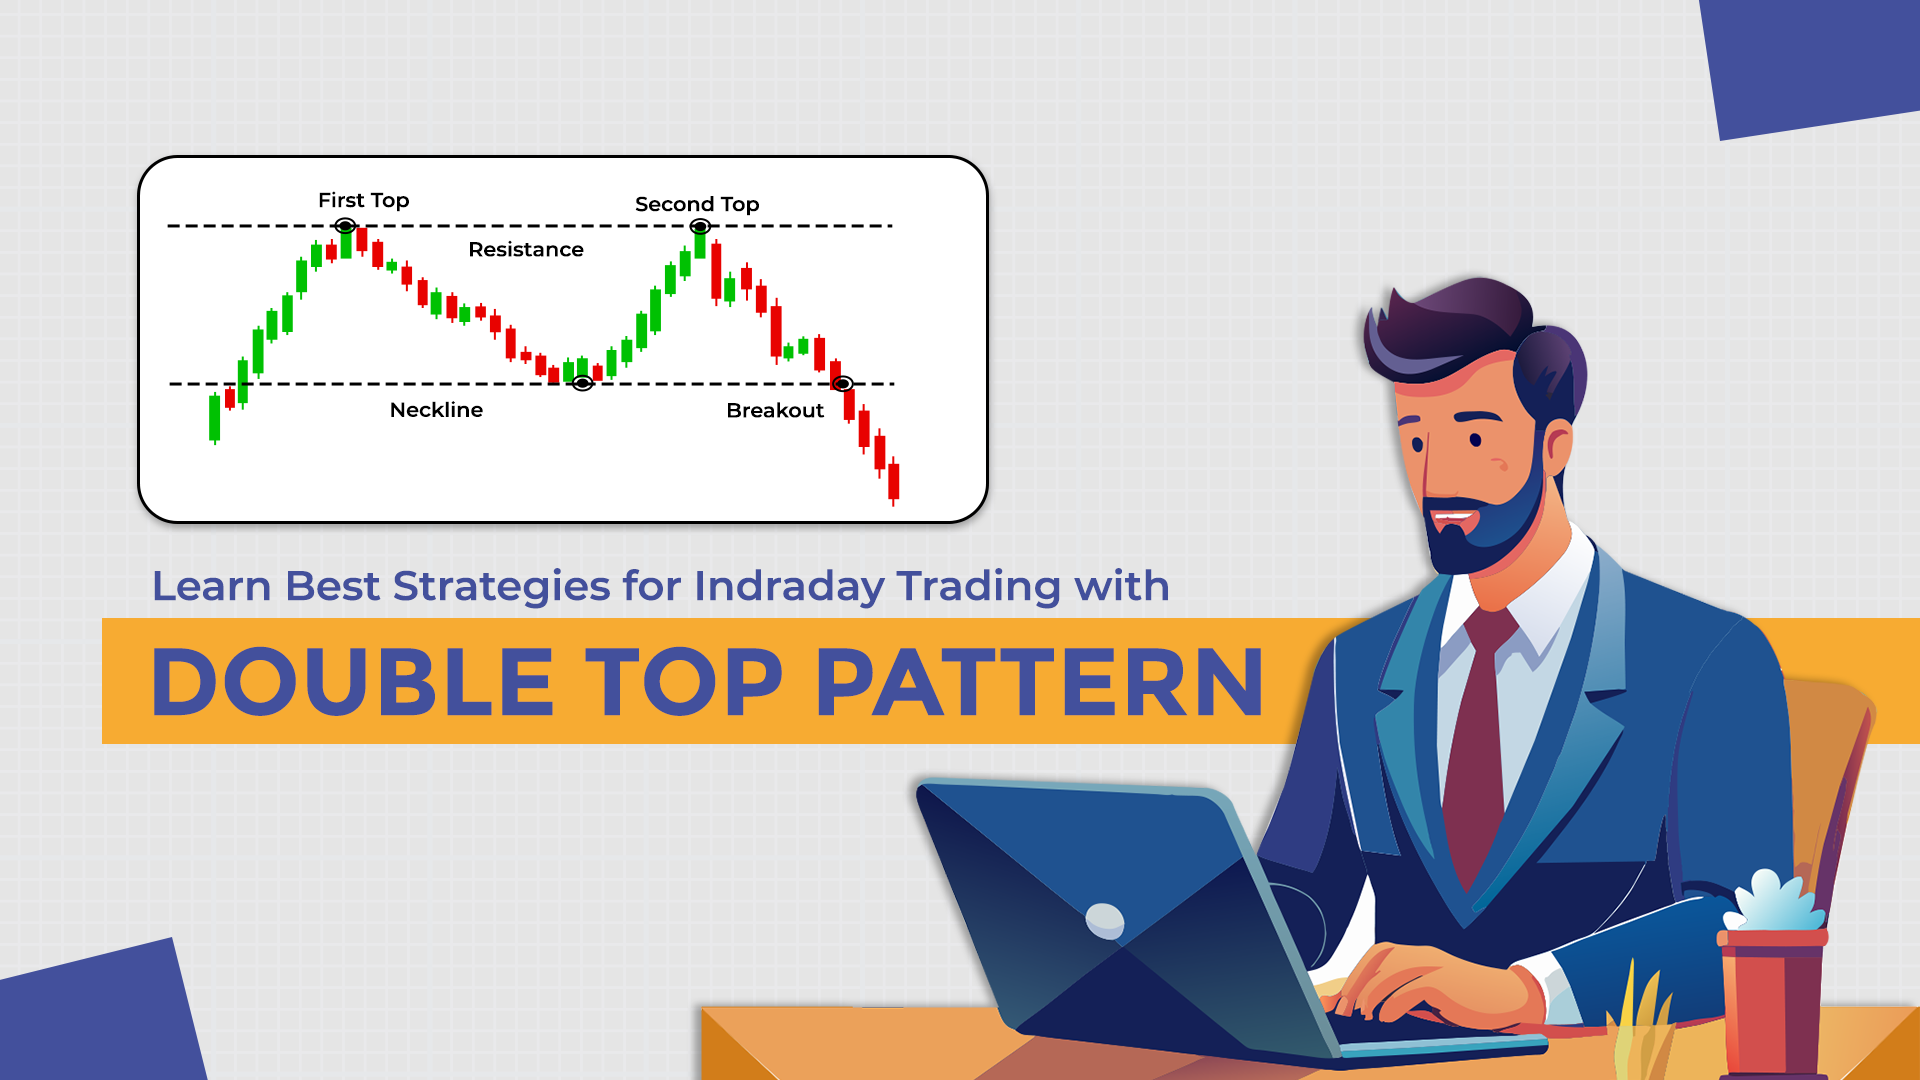
Learn Best Strategies for Indraday Trading with Double Top Pattern
If you are interested in intraday trading or have been exploring technical analysis, you might have come across the name W.D. Gann. He is considered a legendary figure in the world of trading, with theories that traders rely on even today. But who exactly was W.D. Gann, and why are his principles so influential even decades after his time?
Let's dive in to understand Gann's story and his 17 trading principles, which can help you make better decisions and discipline your trading style.
Who Was W.D. Gann?

William Delbert Gann, commonly known as W.D. Gann, was born on June 6, 1878. He began his trading career in 1902 at the age of 24. Gann developed several technical analysis tools like Gann Angles, Circle of 360, Square of 9, and the Hexagon, all based on subjects like astronomy, geometry, astrology, and ancient mathematics. His tools were so innovative and compelling that they continue to guide traders even today, especially in intraday trading.
Among his many contributions, Gann's principles on chart patterns and trading rules are particularly popular for analyzing good stocks for intraday trading.
W.D. Gann's 17 Principles for Successful Trading
Gann's principles act as a guide for disciplined trading. Here are his 17 rules, explained in simple terms:
- Weekly High on Friday Signals Higher Prices If the highest price of the week occurs on a Friday, expect the market to rise further in the next week.
- Weekly Low on Friday Signals Lower Prices If the lowest price of the week happens on a Friday, expect the market to fall further in the following week.
- Weekly Lows in an Uptrend In a strong uptrend, the weekly low usually occurs on a Tuesday.
- Weekly Highs in a Downtrend: In a strong downtrend, the weekly high is often observed on a Wednesday.
- Crossing the High of the Last Four Weeks When the price crosses the highest point of the last four weeks, it's a signal that prices may rise further.
- Breaking the Law of the Last Four Weeks If the price breaks below the lowest point of the last four weeks, it's an early sign of lower prices ahead.
- 30-Day Moving Average (DMA) Rule In an uptrend, if prices fall below the 30 DMA and stay there for two consecutive days, a deeper correction might be coming. The same applies in reverse for a downtrend.
- 5-Day Uptrend and 3-Day Correction After five consecutive days of rising prices, expect a correction lasting three days. The ratio is 5:3.
- Resistance After 100% Rise When a stock's price rises significantly from a certain level, a 100% increase or reaching Rs. 100 (whichever comes first) often acts as strong resistance.
- Crossing the High of the Last Three Days If the price crosses the high of the last three days, expect higher prices on the fourth day. Traders can buy on the fourth day with a stop-loss Rs. 3 below the three-day high.
- More extensive corrections Indicate Trend Reversal If a correction is greater than the previous one in both price and time, it's an early sign that the trend may be reversing.
- 50% Retracement Rule A stock trading below 50% of its last highest selling price is generally not a good choice for investment. This level often acts as a substantial support area.
- 9-Day Uptrend and 5-Day Correction If prices rise for nine consecutive days, expect a correction lasting five days. The ratio here is 9:5.
- Double Bottom Pattern on Monthly Chart Don't ignore a double bottom pattern on a monthly chart after a gap of six months. This is a good signal for mid-term investments.
- Double Top Pattern on Monthly Chart Similarly, a Pattern double top on a monthly chart after six months is a sign that prices may fall, making it unsuitable for investment.
- Volume Spikes During Consolidation In a choppy or consolidating market, a sudden spike in volume often signals that the trend is about to change.
- Quarterly Highs and Lows Indicate Trend Reversal If a stock's price crosses the high or low of the last quarter on a quarterly chart, it's an early signal of a potential trend reversal.
Key Takeaways
These rules provide valuable insights for identifying good shares for intraday trading or understanding chart patterns like double top and double bottom. However, it is essential to follow them strictly and not violate them while trading.
If you incur a loss, review these principles to identify where you might have gone wrong. Learning from mistakes and applying these rules consistently will help you grow as a trader.
Final Thoughts
W.D. Gann's rules might seem simple, but their effectiveness lies in observation and practice. Over time, you will understand how these principles fit into different market scenarios, helping you make informed decisions in intraday trading, stocks, commodities, and even currencies.
Remember, while these rules offer a solid foundation, combining them with a well-thought-out strategy is key to success. Start small, stay disciplined, and let Gann's principles guide you to better trading outcomes.