"In Momentum Investing Strategies Trend is the friend."
This famous quote by Martin Zweig is one of the most well-known sayings in the world of stock trading. And when it comes to momentum trading, it's the perfect mantra. Simply put, momentum trading is about trading with the trend—catching the ride as the stock moves in a particular direction.
For instance, if a company announces strong earnings, and its stock price jumps, a momentum trader would buy that stock and continue to ride the wave as the price goes higher.
Similarly, when a stock's price surges due to a short squeeze, momentum traders may enter the stock market, hoping the price will continue to rise as the squeeze intensifies.
So, what exactly is momentum investing? It's a strategy that involves buying stocks that are trending upwards or short-selling those that are trending downwards. Let's dive into the details.
Momentum investing involves buying assets that are showing strong price trends. The basic idea is that once a price starts moving in a particular direction, it's likely to continue in that direction for a while. Traders who use momentum investing believe that momentum stocks will keep rising or falling based on recent trends.
For example, when a stock's price starts climbing, other traders notice it, and their attention pushes the price even higher. However, once enough people start selling, the trend reverses, and the price starts to drop. This is why momentum traders focus on the trends and ride them while they last.
Momentum investing differs from long-term investing strategies, like the "buy low, sell high" approach, in that it's more about buying high and selling even higher. The key to success is identifying momentum stocks early on and capturing profits before the trend reverses.
To identify momentum in a stock, traders use various tools called momentum indicators. These indicators help us figure out if the price of a stock will keep moving in a particular direction. Here are few of the most popular momentum indicators:

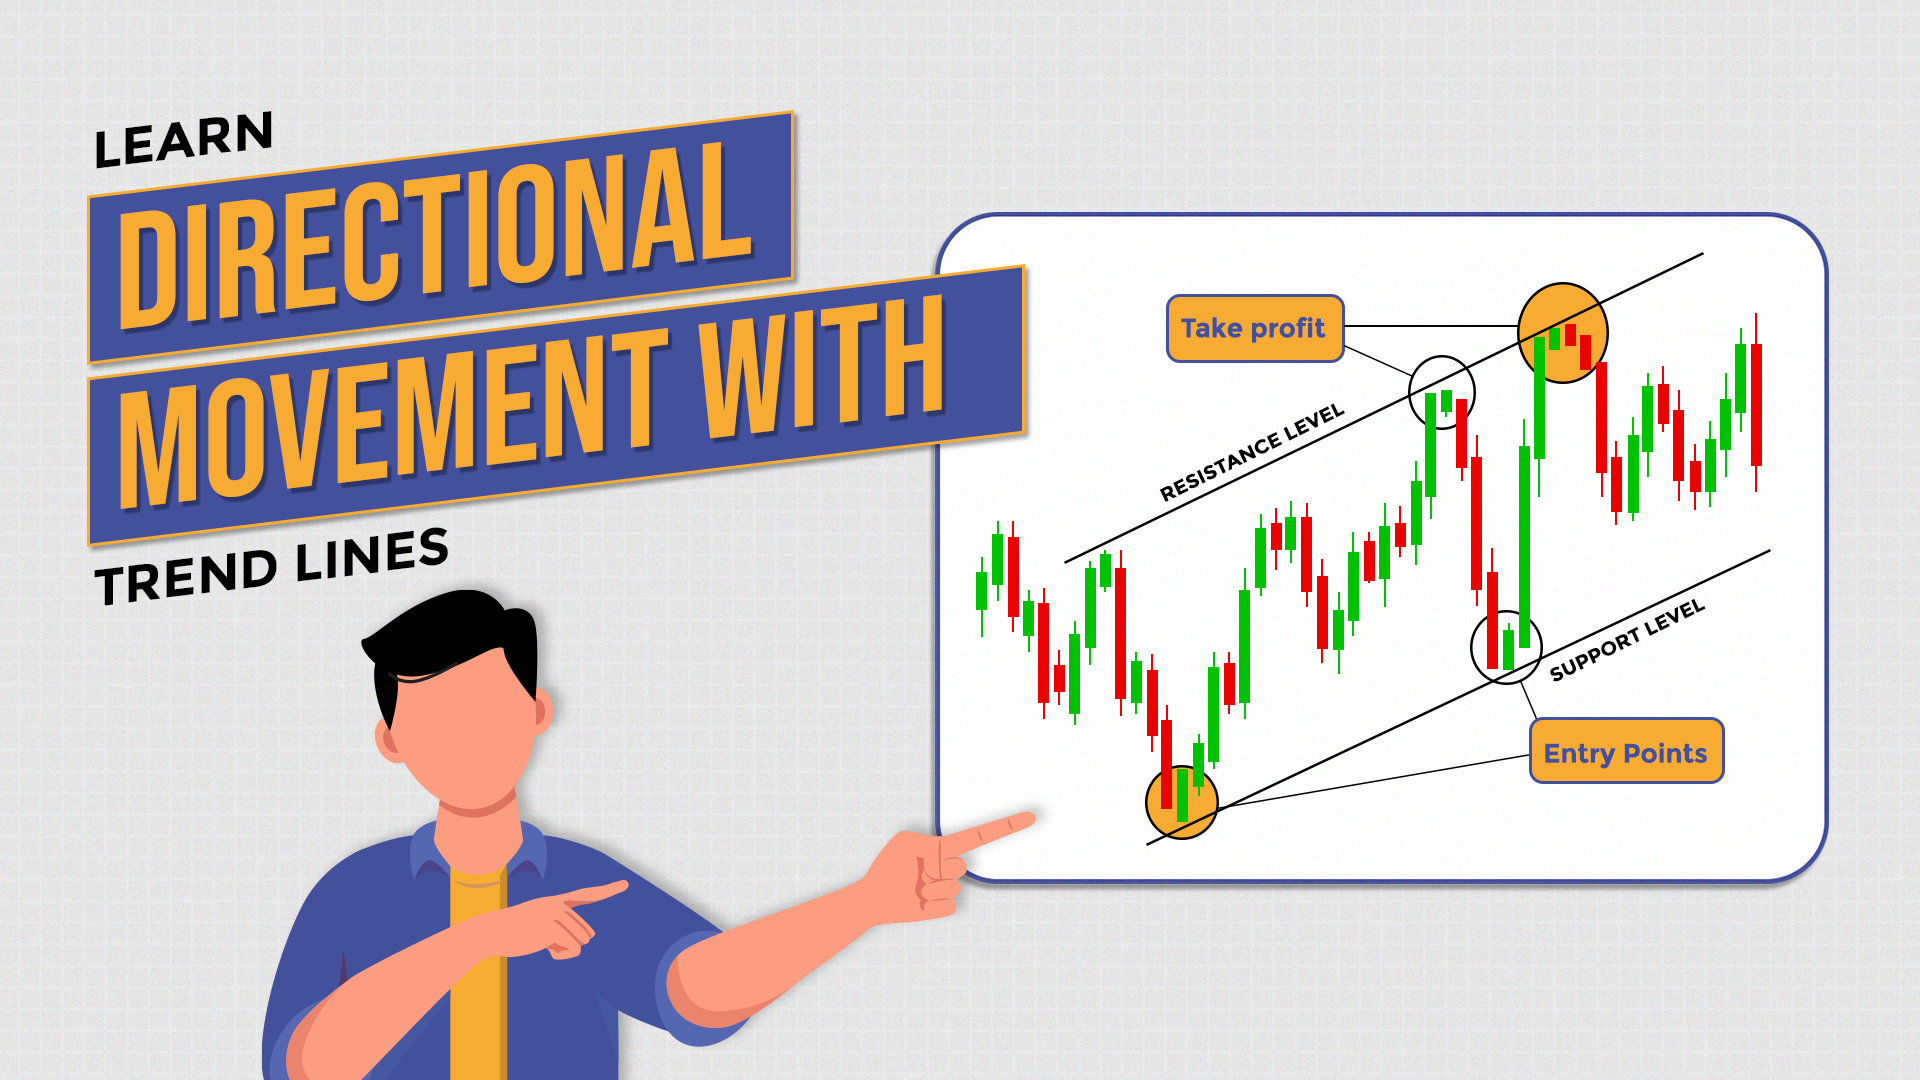
A trendline is one of the most basic yet powerful tools in technical analysis. It's simply a line drawn on a stock chart that connects two price points. If the line slopes upwards, it indicates a bullish trend, suggesting that the stock's price is likely to keep rising. If the trendline slopes downwards, it indicates a bearish trend, and traders might consider selling or shorting the stock.

Moving averages is to smooth out price fluctuations and highlight the overall trend. A simple moving average (SMA) takes the average of a stock's price over a perticular duration. For instance, the average of moving average over 50 days can give a clearer view of the stock's direction. If the stock price stays overhead of the moving average, it's considered an uptrend; if it stays below, it's a downtrend.
")
The Average Directional Index (ADX) or Directional movement indexhelps traders understand the strength of a trend. The ADX ranges from 0 to 100. Values below 25 typically indicate a market with no clear direction, while values above 25 signal the presence of a trend. A high ADX, above 40, shows a strong trend, which is ideal for momentum trading.
")
MACD is another popular momentum indicator. It compares two moving averages (typically the 12-day and 26-day EMA), and the difference between them forms the MACD line. When the MACD line bisect above the signal line, it's a buy signal. When it crosses below the signal line, it's a sell signal.

The stochastic oscillator compares a stock's most recent closing value to its price range over a particular period of time. When the closing price is close to the highest point, it signals a strong trend. Conversely, if the price is near the lowest point, it may indicate a downward trend. Stochastic values range from 0 to 100, with readings above 50 showing strength, and those below indicating weakness.
Momentum investing works by leveragingtrendline tradingand other momentum indicators. Traders use these tools to identify stocks that are showing signs of strong momentum. Once they find a stock that has momentum, they buy it and ride the price up until the momentum starts to slow down.
Price action and momentum indicators like MACD or ADX guide traders to identify when to enter and exit a trade. Here's how it works:
StockEdge is a popular platform where traders can filter stocks based on momentum. By selecting specific momentum trading strategies, traders can easily find stocks that match their criteria for momentum. StockEdge allows traders to choose from bullish, bearish, or continuation strategies, and provides a list of stocks that fit the strategy.
While momentum trading can be profitable, it comes with its risks. One of the biggest challenges is that trends don't last forever. The momentum can slow down, and the stock price may reverse suddenly, causing losses for traders. The key challenge is timing the market—buying just before the stock hits its peak and selling just before it begins to drop.
Momentum traders must also be wary of false signals from indicators, which can lead to poor trade decisions.
To enhance your knowledge of momentum trading, there are various webinars you can attend:
Momentum trading is an exciting strategy that allows traders to profit from strong, trending stocks. By using momentum indicators like trend lines, moving averages, and ADX, traders can enter positions early and ride the wave until the momentum fades. While it can be highly profitable, traders must be cautious of sudden reversals and market volatility.