A Doji candle is a type of candlestick pattern that looks like a cross because the opening and closing prices stand equal or closely the same. The word "Doji" comes from Japanese, meaning a "blunder" or "mistake," as it is rare for the open and close prices to match precisely.
The Doji candlestick pattern is popular among traders because it can signal potential opportunities in the market. Its versatility makes it suitable for traders across different time frames. This pattern forms when the market's open price and close price are almost identical.
The Doji candlestick forms when the market opens, and bullish traders push prices higher, but bearish traders reject these higher prices, bringing them back down. It can also happen in reverse—when bearish traders drive prices lower, and the bulls push them back up.
The movement between the opening and closing prices creates the "wick," while the "body" forms when the price closes nearly at the same level as it opened. Examples include the long leg doji, where the wicks are much longer, showing significant indecision in the market.
When viewed alone, a Doji candlestick pattern shows that neither buyers nor sellers have control, indicating market indecision. In some cases, traders see it as a signal for a possible reversal, known as a reversal doji candlestick or reversal doji candle. However, this isn't always true—it could also mean the ongoing trend will continue.
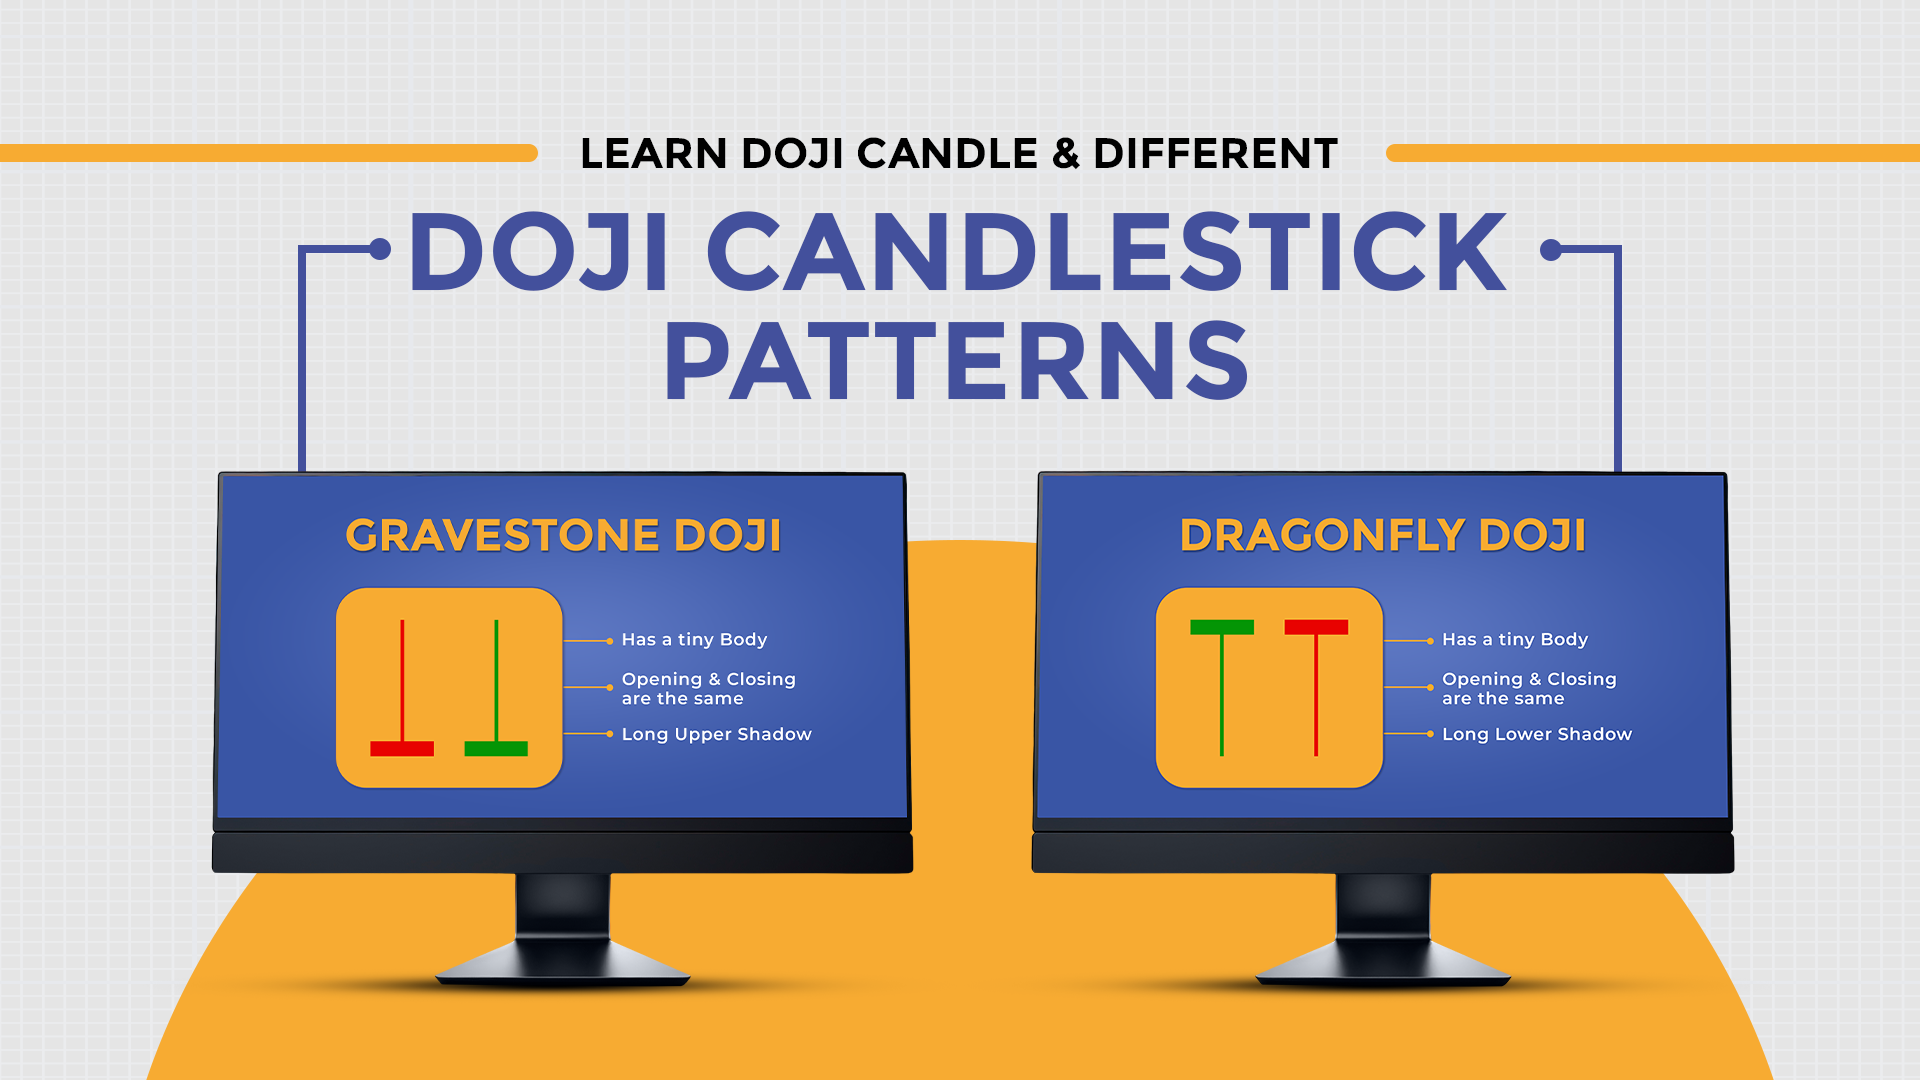
For instance, patterns like the dragonfly doji candlestick pattern and the candlestick dragonfly doji can suggest a possible bullish reversal, while the gravestone doji or candlestick gravestone doji might indicate a bearish reversal. Similarly, the doji dragonfly candlestick and the doji gravestone candlestick help traders analyze the market's sentiment.
The Doji candlestick pattern doesn't provide enough information on its own to make trading decisions. It's essential to use other tools, such as additional candlestick patterns or indicators, to confirm the market's direction.
By studying formations like the bullish candle patterns, bullish candlestick formations, or candlestick formation patterns, traders can better understand the story behind the candle graph patterns and make more informed decisions.

There are various kinds of Doji candlestick patterns, including the Common Doji, Gravestone Doji, Dragonfly Doji, and Long-Legged Doji. Let's take a closer look at these types of Doji:
In the chart of Mayur Uniquoters Ltd, a Doji candle is seen forming at the end of an uptrend. This signals that the ongoing trend has become uncertain. Following the Doji candlestick, the Dark Cloud Cover candlestick pattern confirms a reversal, as shown in the chart:

The spinning top is similar to the Doji candlestick pattern, but the main Difference lies in its body size. A Doji candlestick typically has a tiny body, whereas the real body represents up to 5% of the candle's entire range. If the body is more significant, it is classified as a spinning top.
A spinning top candlestick indicates weakness in the current trend, just like a Doji candlestick, but traders need additional confirmation. When spotting either pattern, it's crucial to use other tools, such as Bollinger Bands, to determine whether they indicate a trend continuation or reversal.
You can scan for the Doji candlestick pattern using the web version. Here's how:
This makes it easy to identify stocks where a Doji candlestick is formed.
In isolation, the Doji candlestick is a neutral indicator and does not provide sufficient information for trading decisions. Moreover, the Doji candlestick pattern is not commonly formed, making it less reliable for spotting price reversals.
Even when a Doji candle does form, there is no guarantee the price will move in the expected direction after the confirmation candle. Additionally, estimating potential rewards from a Doji candlestick can be challenging.
For better results, traders should combine the Doji candlestick with other technical tools like additional candlestick patterns, analysis indicators, or strategies to make informed decisions.
A Doji is a type of candlestick pattern that resembles a cross because the opening and closing prices are equal or nearly the same. When viewed in isolation, a Doji candlestick signals indecision in the market, as neither buyers nor sellers are in control.
There are various types of Doji candlestick patterns, including the Common Doji, Gravestone Doji, Dragonfly Doji, and Long-Legged Doji. However, traders should avoid making decisions solely based on the Doji candlestick chart pattern and instead pair it with other patterns and indicators for better confirmation.
