When we talk about the stock market, many people think it's all about numbers and graphs. However, understanding the market sentiment is like feeling the pulse of the market. Are most investors confident, or are they cautious? That's where market breadth indicators come in—they help us measure how healthy the market is and whether the trends we see today will last.
If you're new to investing or simply curious, don't worry! This guide will simplify these concepts and help you understand the current marketsentiment using five key indicators.
Let's start with a simple analogy. Imagine you're playing a team sport. If most players are performing well, the team has a better chance of winning. In the stock market, the same applies: if most stocks are doing well, the overall market is strong. This idea is what we call market breadth.
Market breadth helps answer questions like:
For example, if only a few stocks are driving a bullish market (prices rising), it could signal weak market sentiment and a risk of reversal. On the other hand, a broad-based rally shows an intense market mood and confidence among investors.
Understanding the market sentiment today can help traders decide whether to invest, hold, or sell.
But what does bearish mean?
A bearish market definition is simple: it's when stock prices fall over a period of time, signalling negative market mood and weaker investor confidence.
Here are five key tools to understand the market mood index and identify patterns that can help you trade better.
This indicator tells us how many stocks are trading above their average price over a specific period, such as 50 or 200 days.
Why it matters:
This indicator reflects the current market sentiment and helps identify whether the market has strong support from many stocks or just a few.
Relative Strength compares a stock's performance with its peers.
For example, If most stocks in the share market show strong relative Strength, it confirms a healthy market index mood.

This indicator tracks how many stocks are near their recent highs or lows.
Why it matters: It highlights whether stocks are gaining momentum or losing ground, reflecting the market mood index today.

The advance/decline ratio compares the number of stocks rising to those falling.
Why it matters: It shows the balance of power between buyers and sellers, helping traders gauge the market mood.

This indicator calculates the difference between stocks hitting new highs and those hitting new lows.
Why it matters: It's a quick way to check whether more stocks are breaking records or losing value, reflecting the current market sentiment.
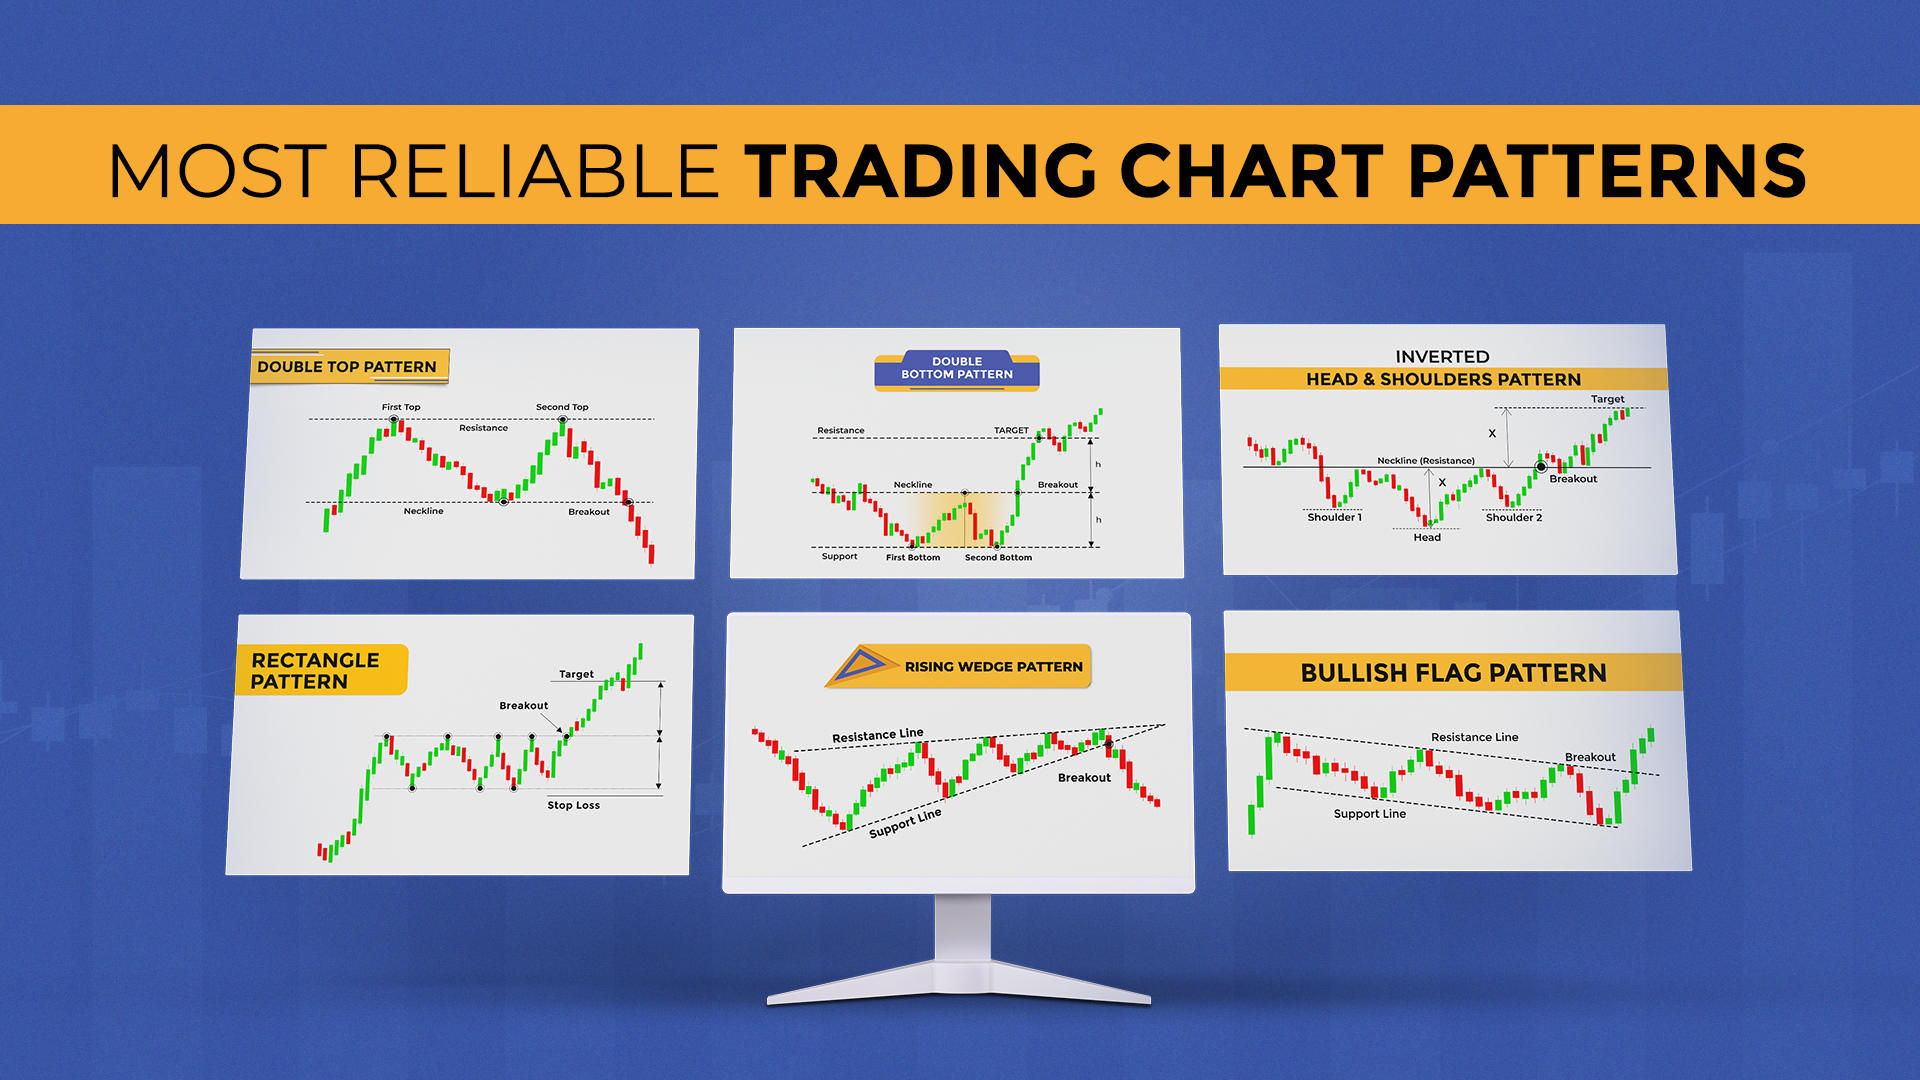
Using chart patterns is an excellent way to confirm what market breadth indicators tell us. Patterns like:
For example, if the share market chart patterns show a trend reversal after weak breadth indicators, it's a strong sign of a potential bearish market.
In addition to breadth indicators, traders use technical indicators like moving averages, RSI (Relative Strength Index), and Bollinger Bands to strengthen their analysis. These trading indicators help pinpoint the best times to buy or sell stocks.
Recognizing patterns in trading charts is crucial for making informed decisions. Look for:
For example, if share market patterns suggest a potential breakout, it could mean a new opportunity is around the corner.
Combining market breadth indicators with trading patterns gives traders a complete view of the market. It's like using a compass and a map together & they work better as a team.
Example:
If breadth indicators show a strong market mood index and stock market chart patterns confirm the trend, it's a sign of confidence.
Understanding the current market sentiment is essential for any trader or investor. By using market breadth indicators and studying chart patterns, you can make smarter decisions and reduce risks.
Always remember: no single indicator is perfect. Combine tools like breadth indicators, technical analysis chart patterns, and trading indicators to improve your strategy.
Whether you're a beginner or an experienced trader, these tools will help you navigate the ups and downs of the stock market with confidence.