Dive into the intriguing concepts behind Fibonacci ratios and discover how these mathematical wonders are woven into the fabric of nature, art, and finance. Unravel the secrets of this captivating sequence and learn how it can unlock patterns and insights in various aspects of life.
Join us on this enlightening journey to understand the beauty and significance of the Fibonacci scale! In the 12th century, an Italian mathematician called Leonardo Bonacci, also known as the Fibonacci effect, introduced the Western world to the Hindu-Arabic numeral system through his bookLiber Abaci.
This groundbreaking text not only popularized the use of the digits 0–9 but also demonstrated their practical applications in areas such as bookkeeping, weights and measures, and calculating interest.
According to Wikipedia:"In his 1202 workLiber Abaci, Fibonacci pattern introduced the modus Indorum, or the 'method of the Indians,' now identified as the Hindu-Arabic numeral system. This revolutionary book promoted the use of digits 0–9 and the concept of place value. It also showcased the practical applications of the Arabic numeral system in commerce and everyday calculations, leaving a lasting influence on European intellectual development."
This article explores the fascinating concepts of the Fibonacci sequences and their applications.
The Fibonacci sequence is a series of numbers where each term is the sum of the two foregoing ones. It starts with 0 and 1 and progresses as follows: 0, 1, 1, 2, 3, 5, 8, 13, 21, 34, 55, 89, 144, 233, and so on.
These numbers, known as Fibonacci number series, are represented by the fibonacci equation:
Fn = Fn−1 + Fn−2
The sequence is integral to various mathematical and natural phenomena and forms the basis for many fibonacci principles, such as the golden ratio and Fibonacci retracement.

The golden ratio, represented by the Greek letter φ (phi), is about 1.618. It is derived when the ratio of two quantities equals the ratio of their sum to the larger of the two quantities. Mathematically:
φ = (a + b) / a = a / b
The golden ratio is usually referred to as the divine ratio due to its prevalence in art, architecture, and nature.
A golden rectangle is one in which the proportion of its length to its width is equal to the golden ratio (approximately 1.618). This unique shape can be divided into a square and a smaller golden rectangle, continuing infinitely.
The Fibonacci spiral numbers start with a golden rectangle, which is repeatedly divided into squares. By drawing quarter circles through the corners of these squares, a spiral is formed. This spiral often appears in nature, such as in the patterns of shells, hurricanes, and galaxies.

Fibonacci numbers and the golden ratio are evident in numerous natural phenomena. From the arrangement of leaves on a stem (phyllotaxis) to the spiral patterns of pinecones and sunflowers, these sequences reflect the intrinsic harmony of nature.
These ratios are crucial in identifying support and resistance levels in trading.
Let's understand the Fibonacci Retracement and Fibonacci Progression in Stock Market
Fibonacci Progression: The ongoing movement of stock prices in a consistent upward or downward trend, reflecting sustained buying or selling pressure over time.
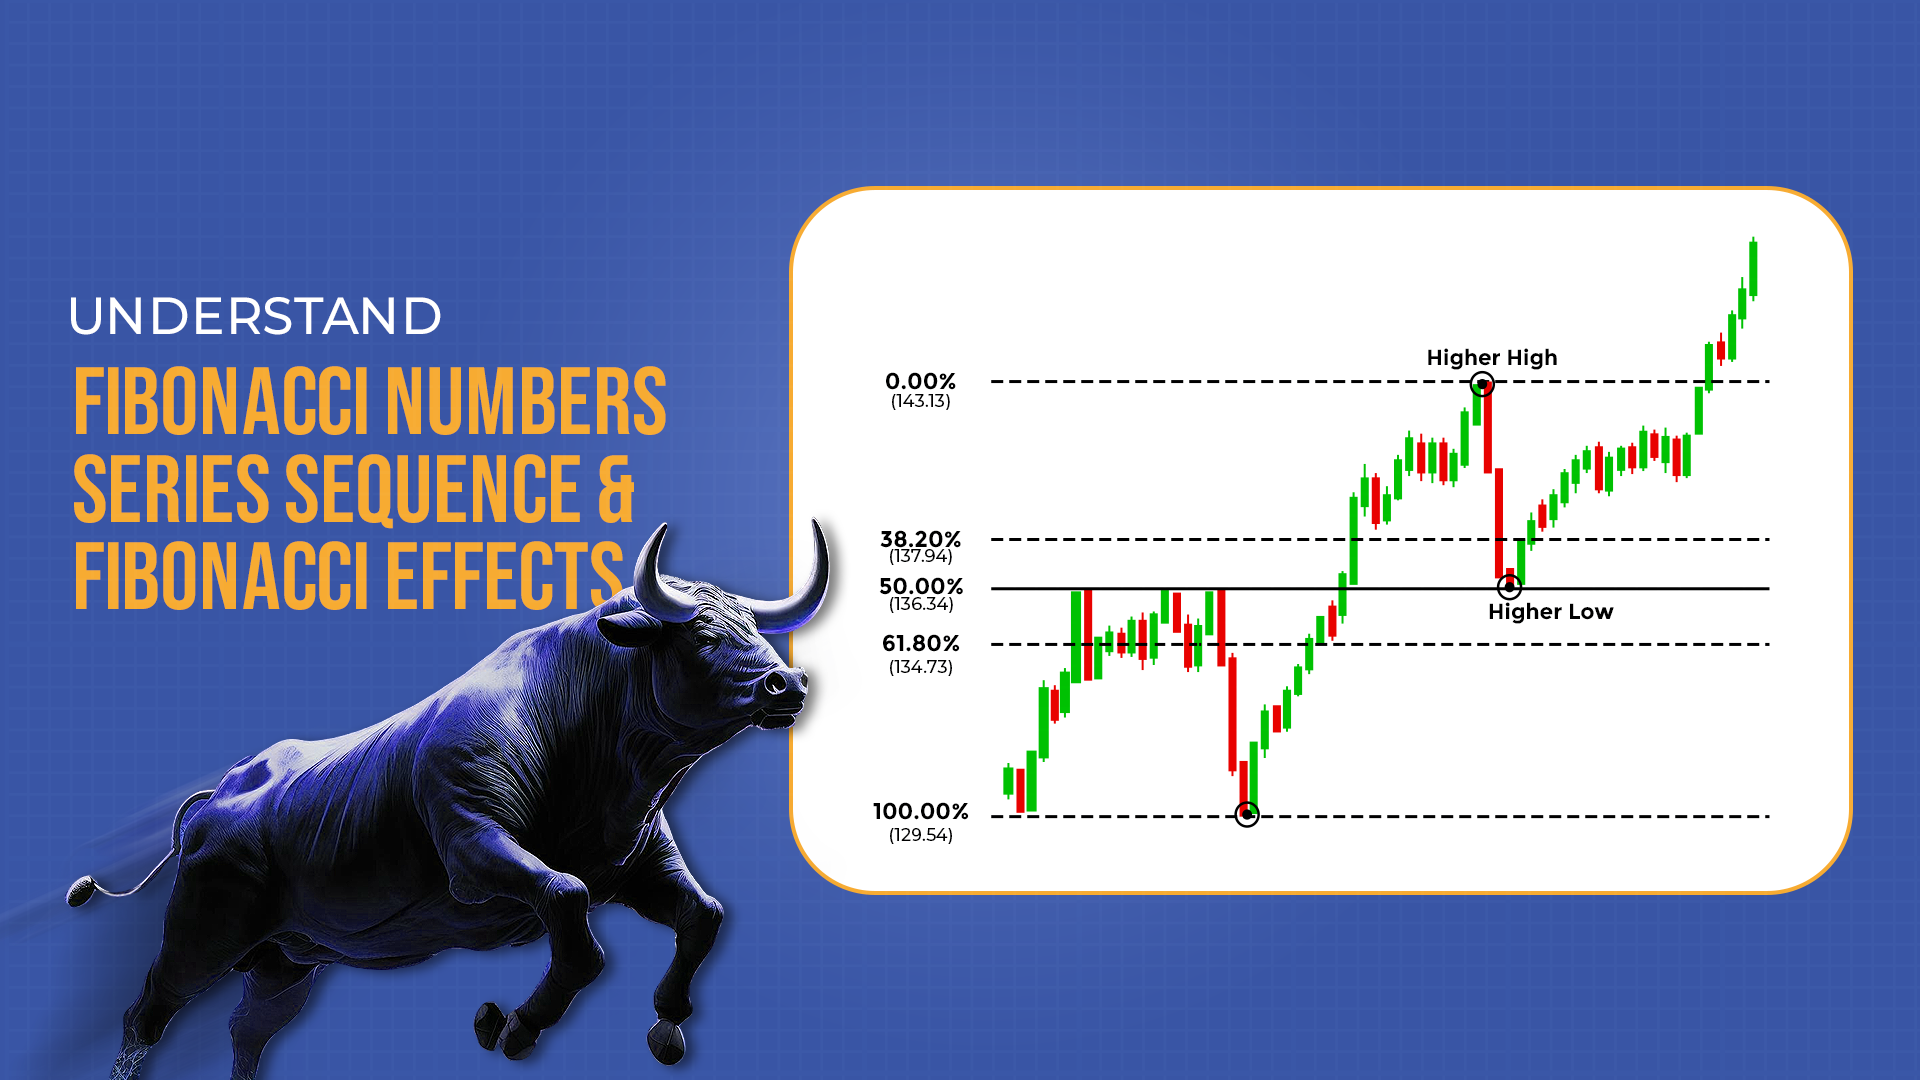
Fibonacci Retracement:A short-term reversal in the price direction, often a pullback in an uptrend or a bounce in a downtrend, indicating temporary price corrections. Fibonacci retracement levels are horizontal lines used to determine potential support and resistance points in market analysis. These levels are derived from key Fibonacci ratios (23.6%, 38.2%, 50%, 61.8%, and 100%).
Key Points:
By integrating Fibonacci retracements into your trading strategy, you can recognize entry and exit points, manage risks, and optimize returns.
Fibonacci ratios and sequences are not just mathematical curiosities but practical tools with applications in art, nature, and financial markets. Understanding concepts like the Fibonacci sequence, golden ratio, and Fibonacci retracements can provide traders with a robust framework for identifying key market levels and making informed decisions.

The limit of the Fibonacci ratio is approximately 1.6180339.
The Fibonacci sequence appears in biological settings like branching in trees, flower petals, pinecones, and spiral shells.
The ideal time frame is a 30-to-60-minute candlestick chart.
The golden ratio is a mathematical concept represented by φ (approximately 1.618) and is observed in art, architecture, and nature.
Fibonacci retracements help traders identify potential support and resistance levels, allowing for better risk management and decision-making.