Technical trading is the heart of trading for those who use technical analysis as a method for their trading. These indicators, including the relative strength index (RSI) and commodity channel index (CCI), are considered essential when one-day trades or swing trades.
These indicators are considered to be important when one-day trades or swing trades. The primary notion of technical analysis is to measure future price movements using tools such as the strength index or moving average convergence divergence (MACD). Moving on, technical indicators are technically divided into leading and lagging indicators. In this blog, we will dive into both types of indicators, including examples of leading and lagging indicators, and help you identify which may suit your trading strategy.
When analysing market trends, it's crucial to distinguish between lagging and leading technical indicators to make informed decisions. A prominent leading indicator is the relative strength index indicator, commonly referred to as RSI.
The relative strength index RSI indicator measures the momentum and speed of price movements, helping traders identify overbought or oversold conditions within the range. Unlike lagging indicators, the relative strength indicator RSI offers real-time insights into potential trend reversals, making it an essential tool for traders to anticipate market moves effectively.
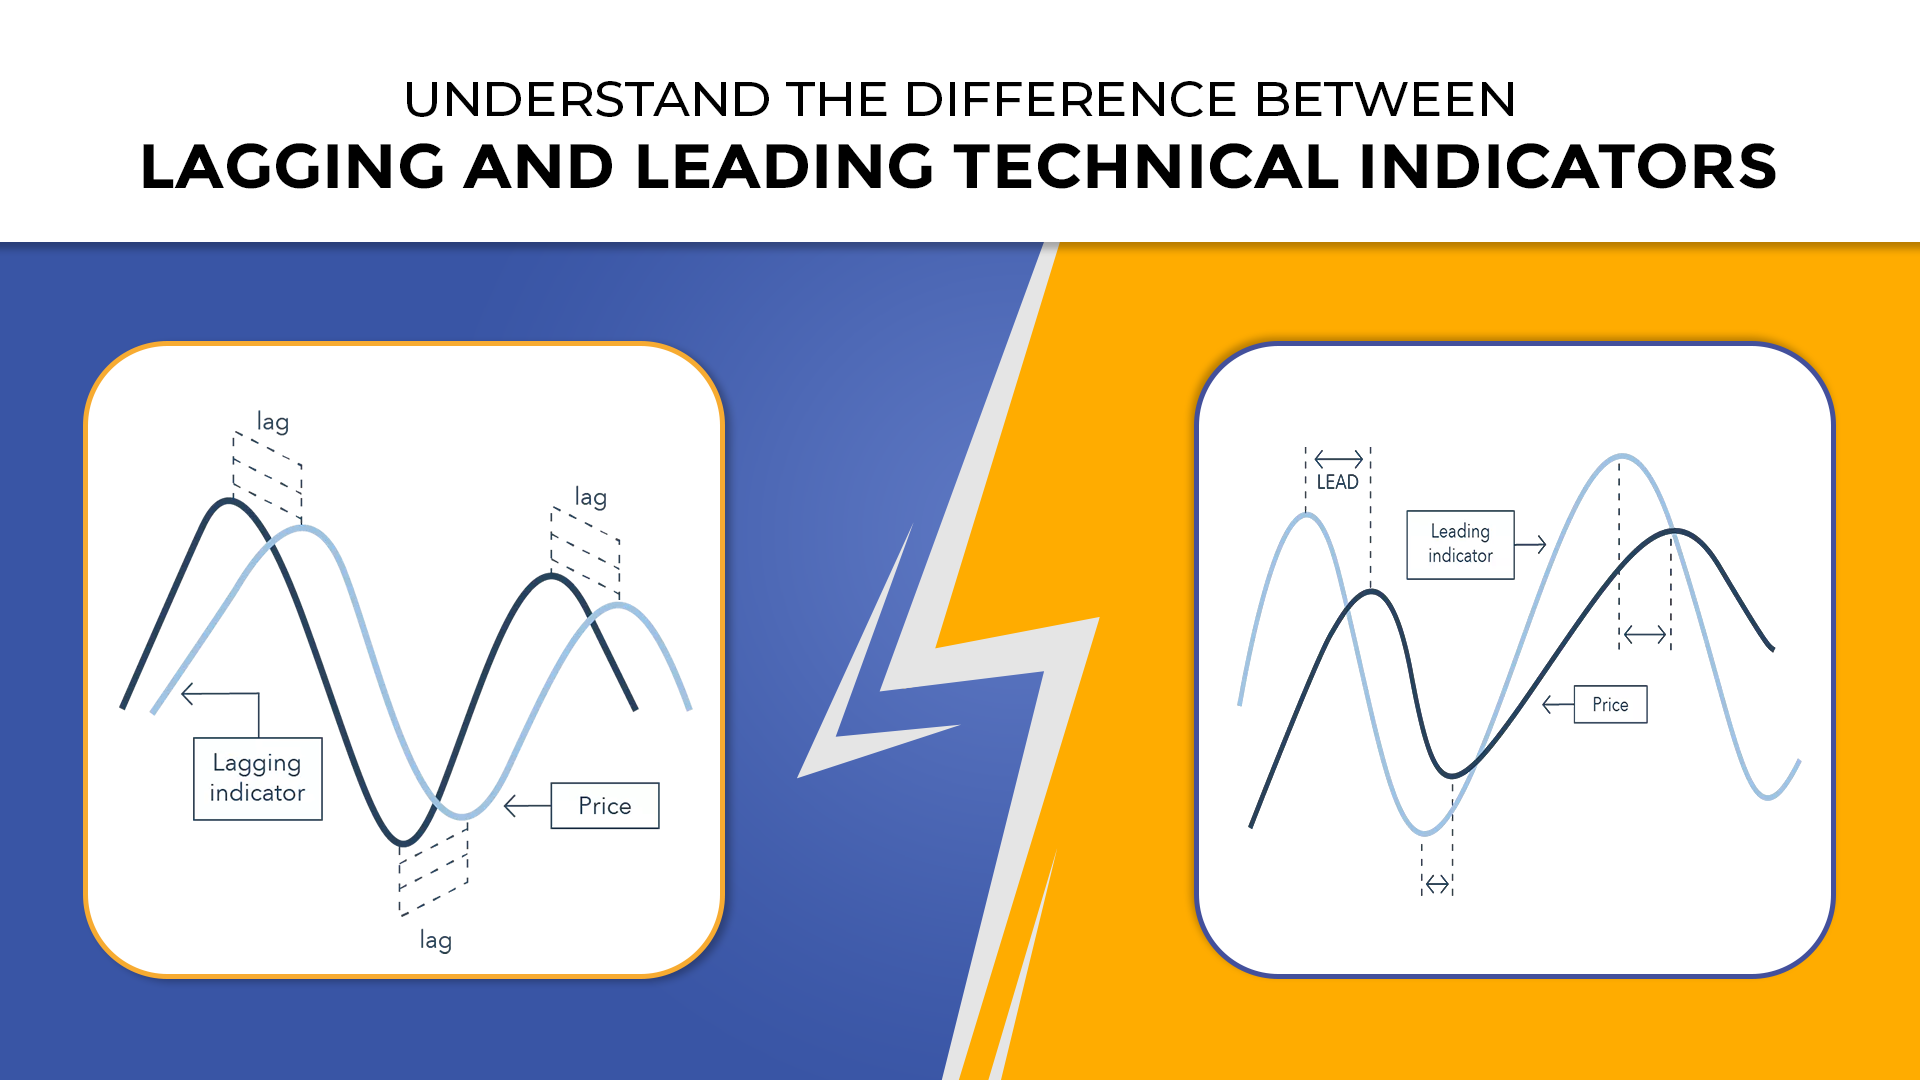
Leading indicators are designed to expect further price movements to give the trader an edge in trading. They allow opportunities to trade and provide an early signal of entry and exit.
Some of the well-known leading indicators are:
The commodity channel index (CCI) is particularly effective for identifying overbought and oversold conditions. Similarly, the RSI indicator, a measure of stock relative strength, is widely used for RSI trading. Traders also rely on the relative strength indicator formula to calculate RSI values accurately.
Volume, another leading indicator, often reveals changes in buying and selling pressures in the market, even before prices move significantly. This feature makes it a strong complement to other tools, such as the RSI index.
Lagging indicators follow a trend or an event and then predict price reversals. If the price moves in a long trend, these indicators work well. They simply tell whether the prices are increasing or decreasing so that one can invest accordingly. They do not signal upcoming changes in prices.
Even though lagging indicators provide delayed feedback, many investors choose them for trading. To confirm price trends, traders mostly use more than two lagging indicators for trading in the stock market.
The moving average and moving average convergence and divergence (MACD) are two examples of lagging indicators:


Traders usually find it challenging to balance between using leading and lagging indicators. If you rely solely on leading indicators or lagging indicators, chances are that you might get a lot of false signals. Seeing the drawbacks, it is best to develop a trading strategy using both lagging and leading indicators.
At the end of the day, it depends on your trading style and objectives. A balanced approach that combines both can enhance your decision-making process in dynamic markets, whether you're day trading or swing trading.
In conclusion, it is essential to know the difference between lagging and leading technical indicators for developing a well-rounded strategy. Both types of indicators have their strengths and weaknesses, and using them in conjunction can provide a complete view of market trends. While leading indicators may offer early entry and exit signals, they are prone to false alerts. On the other hand, lagging indicators help confirm trends but may react too slowly. A successful trading strategy combines inferences from both rather than entirely relying on one.
