When trading, understanding different chart patterns can be the key to making better decisions. One such pattern, the symmetrical triangle, is essential for both beginners and experienced traders. This article will help you easily understand the concept and application of this pattern. Along the way, we'll explore related terms like the ascending triangle pattern, triangle ascending pattern, and more.

A symmetrical triangle is a technical analysis chart pattern formed when a stock's price moves in a way that creates two converging trend lines. The upper line connects lower highs, and the lower line connects higher lows, forming a triangle that narrows toward an "apex." This pattern shows a period of indecision in the market where buyers (bulls) and sellers (bears) are at a standoff.
The breakout from these trading chart patterns – when the price moves outside the converging lines – usually signals a continuation of the prior trend or the start of a new trend. This breakout can happen in either direction, making it essential for traders to watch closely.
Recognizing a symmetrical triangle involves a few steps:
Trading with this pattern can be a simple yet effective trading strategy if done correctly:
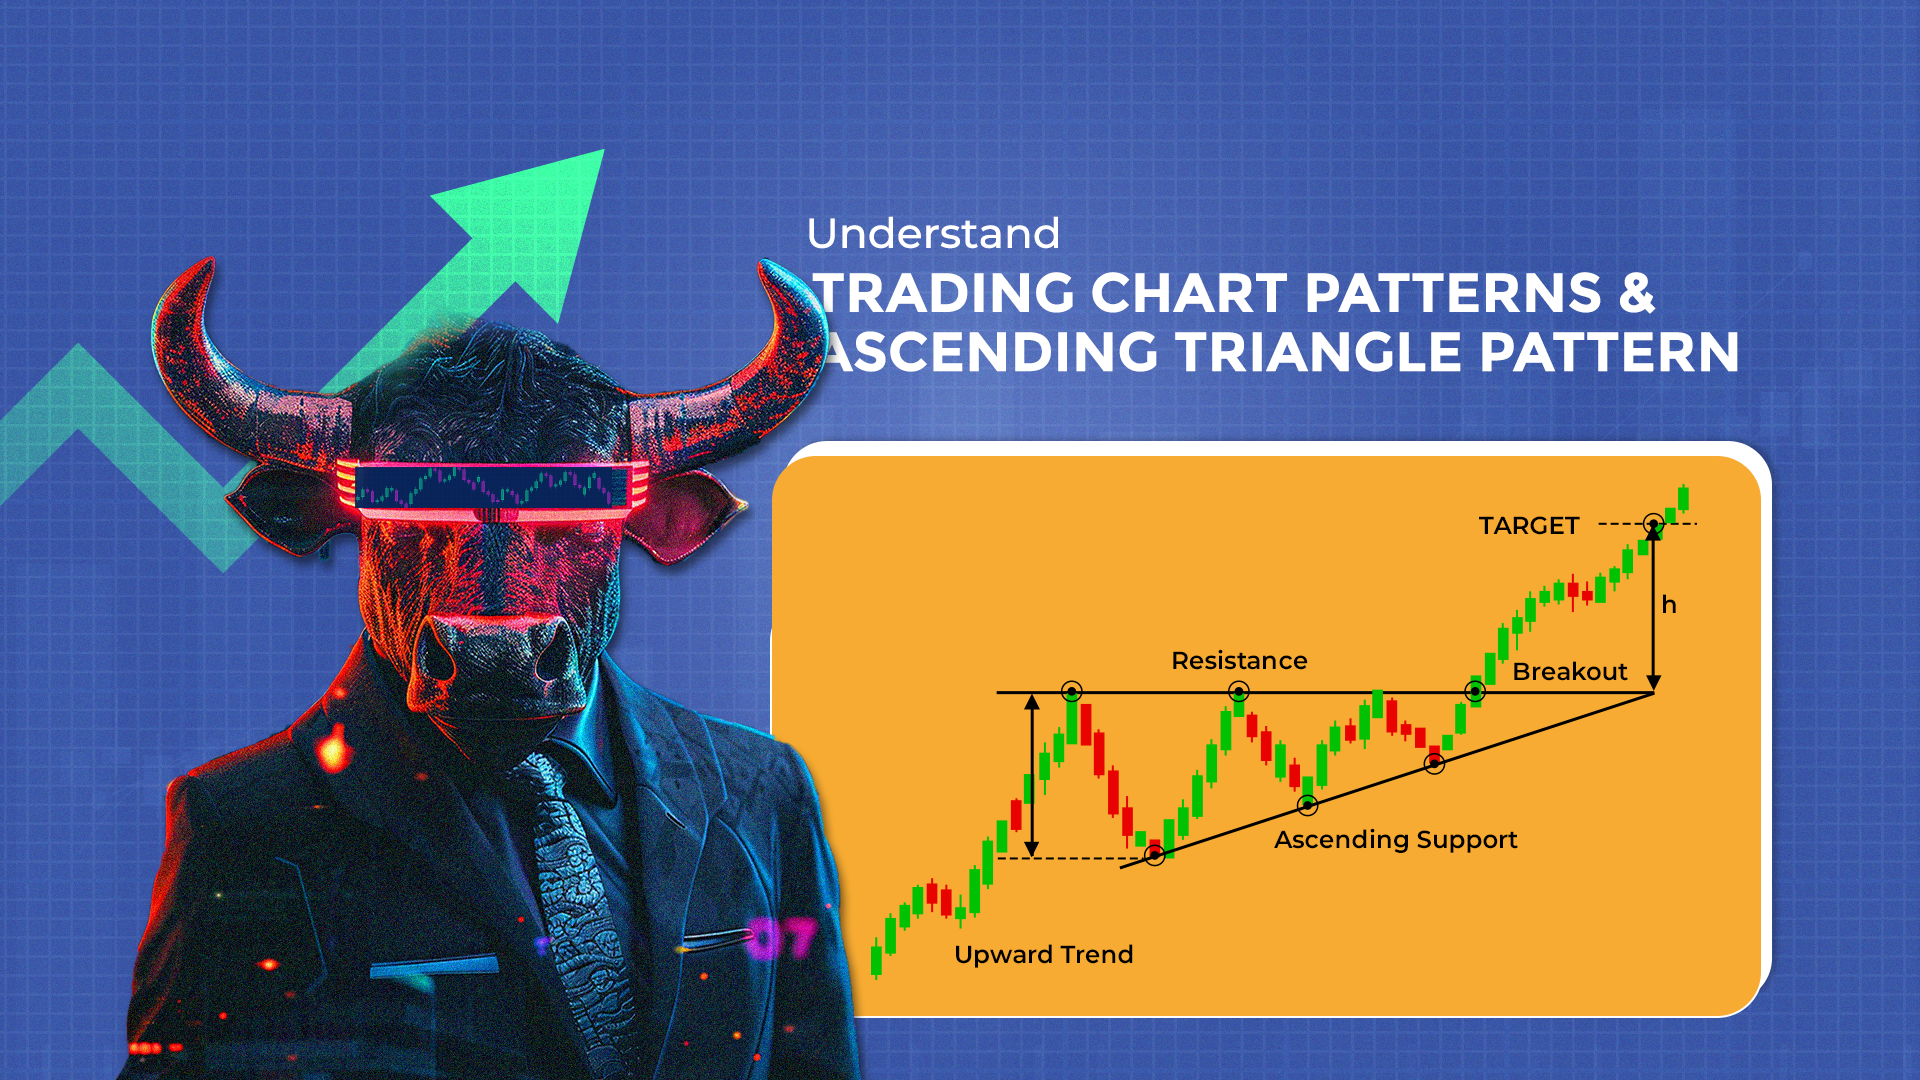
While the symmetrical triangle shows equal pressure from buyers and sellers, the ascending triangle pattern is slightly different. An ascending triangle has a horizontal upper trend line and an ascending lower trend line, often signalling bullish breakouts.
Other patterns, like the triangle ascending pattern, triangle breakout pattern, and triangle chart pattern, can also guide traders in understanding market trends.
This pattern allows traders to capitalize on significant market movements, whether upward or downward. When combined with other trading techniques, such as volume analysis and technical analysis chart patterns, it provides a powerful tool for decision-making.

It is a technical chart pattern formed by converging trend lines, indicating a period of market indecision before a breakout.
A symmetrical triangle is neutral. The direction of the breakout (upward or downward) determines if it's bullish or bearish
An ascending triangle pattern has a flat upper trend line and a rising lower trend line, signalling bullish sentiment, while a symmetrical triangle is neutral until the breakout.
Mastering chart patterns like the symmetrical triangle and the ascending triangle pattern is essential for traders. These patterns, supported by tools like technical analysis chart patterns, help identify opportunities in the stock market. By understanding triangle breakout patterns and trading chart patterns, traders can develop robust stock market strategies and refine their trading techniques.
Make sure to practice and backtest these patterns to enhance your beginner stock trading skills. With time and effort, you will be able to use these patterns effectively for more intelligent trades.