In 1987, J. Welles Wilder designed the Average Directional Index (ADX). It is a crucial stock market indicator used in technical analysis to measure the power of a trend. Initially designed for commodities, the ADX Indicator has since become a popular tool among traders analyzing both stocks and commodities. By quantifying the velocity of price movement, ADX provides beneficial data on the strength of a trend, regardless of its direction. In this blog, we will delve into the components of ADX, including the Positive Directional Indicator (+DI) and Negative Directional Indicator (-DI), and explain how they work together.
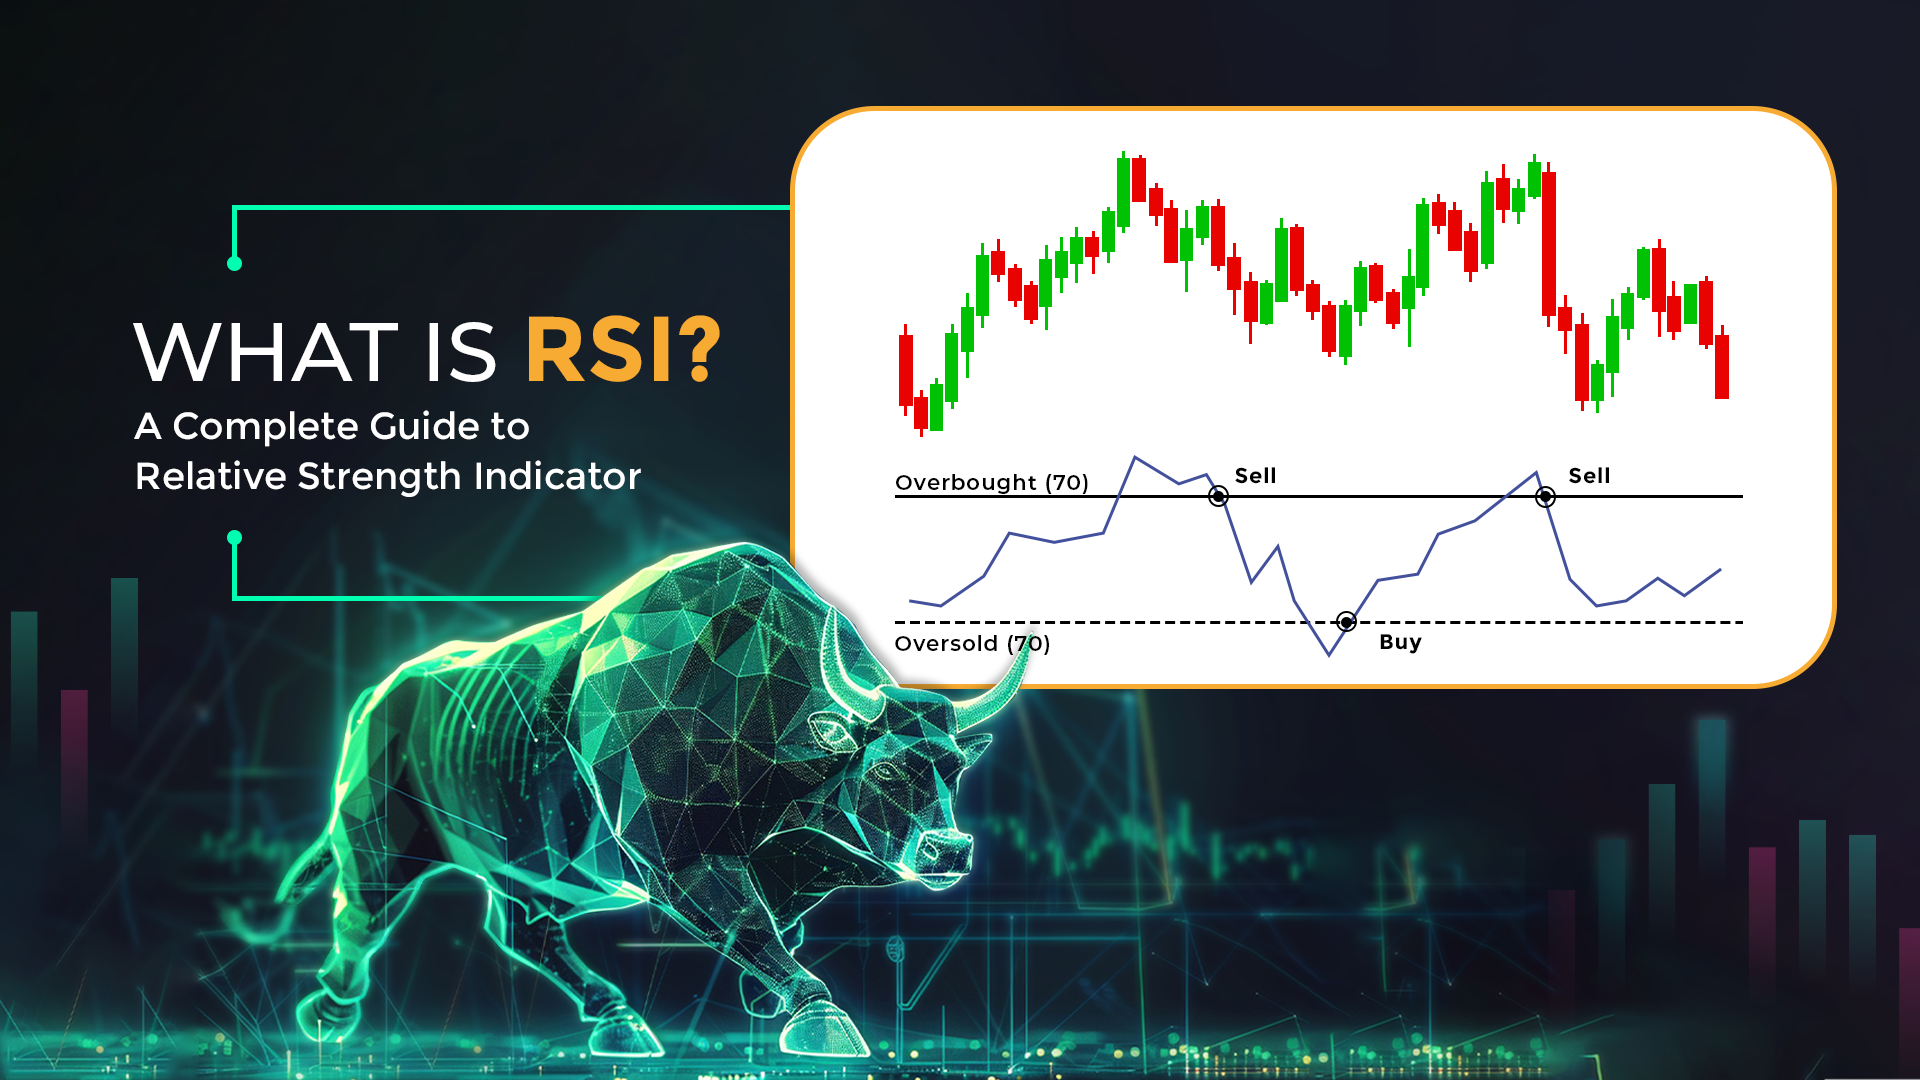
The Average Directional Index (ADX) is a powerful tool for measuring the strength of a trend, but its effectiveness can be amplified when used alongside the Relative Strength Index (RSI) indicator. The RSI index, or Relative Strength Indicator RSI, is a momentum oscillator that evaluates the speed and change of price movements, making it ideal for identifying overbought or oversold conditions. By combining ADX with the Relative Strength Index rsi indicator, traders can confirm whether the trend's strength aligns with the momentum indicated by the RSI strength indicator. This strategic approach ensures a more comprehensive analysis of the market's behavior, leveraging both the directional aspect of ADX and the momentum insights from the Relative strength index rsi indicator.

The Average Directional Index (ADX) consists of three lines: ADX, +DI, and -DI. The ADX quantifies the strength of a trend, while the +DI and -DI help determine the direction of that trend.
The +DI indicates an uptrend when its value crosses above the -DI. A steeply rising +DI suggests a strong uptrend.
Calculation: When the current high minus the previous high is greater than the previous low minus the current low, the Directional Movement Index (DMI) is positive (plus).
The -DI signals a downtrend when it crosses above the +DI. A steeply rising -DI indicates a strong downtrend.
Calculation: The DMI Indicator is negative (minus) when the previous low minus the current low is greater than the current high minus the previous high.
In the ADX calculation, the following actions are taken:
Where +DM and -DM are directional movements, and ATR is the Average True Range, which measures volatility.
The Average True Range (ATR), developed by Wilder, measures volatility. It accounts for price gaps, and limit moves that a regular high-low range would miss.
Parameters for Trend Strength:
Using the ADX Indicator, traders can assess the trend strength and make more informed trading decisions:
The ADX indicator is a powerful tool for traders, helping them identify the strength of a trend and make informed trading decisions. By using ADX in combination with other indicators like the Relative Strength Index (RSI), traders can increase the probability of successful trades. Understanding when a trend is strengthening or weakening allows traders to better time their entries and exits, reducing risk and increasing profitability.
