When learning about the stock market, many beginners overlook an essential factor: volume. But ignoring this can lead to missed opportunities. Volume is one of the most valuable tools for understanding price movements in stocks. If you want to become a successful trader, it's essential to learn about volume, why it matters, and how you can use it effectively in your trading strategy.
Are you also curious to know,what is volume? It is the total number of shares bought or sold within a specific time frame—usually a day. It shows how active a stock is during that period.
For example:
If the volume of a stock is 1,500,000 shares in one day, it means that 1,500,000 shares were sold and bought during that time.
A stock with a high volume means more people are trading it. This usually happens when there is big news about the company, such as financial results, product launches, or industry updates. Volume tells you whether a stock is in demand or not.
You can find volume data on stock charts or trading platforms, as it is commonly displayed alongside price movements. Most financial websites also include this information to help investors make decisions.
Volume acts as a confirmation tool in trading. It helps you understand if the price movements of a stock are strong or weak. Let's look at some key reasons why volume is essential:
If a stock's price is rising and volume is also increasing, it's a sign that the trend is strong. More traders are buying, which pushes the price higher.
If prices move up or down with low volume, it could be a weak signal, and the trend might not last.
A reversal is when the price of a stock changes direction. By watching the volume, you can sometimes predict these reversals:
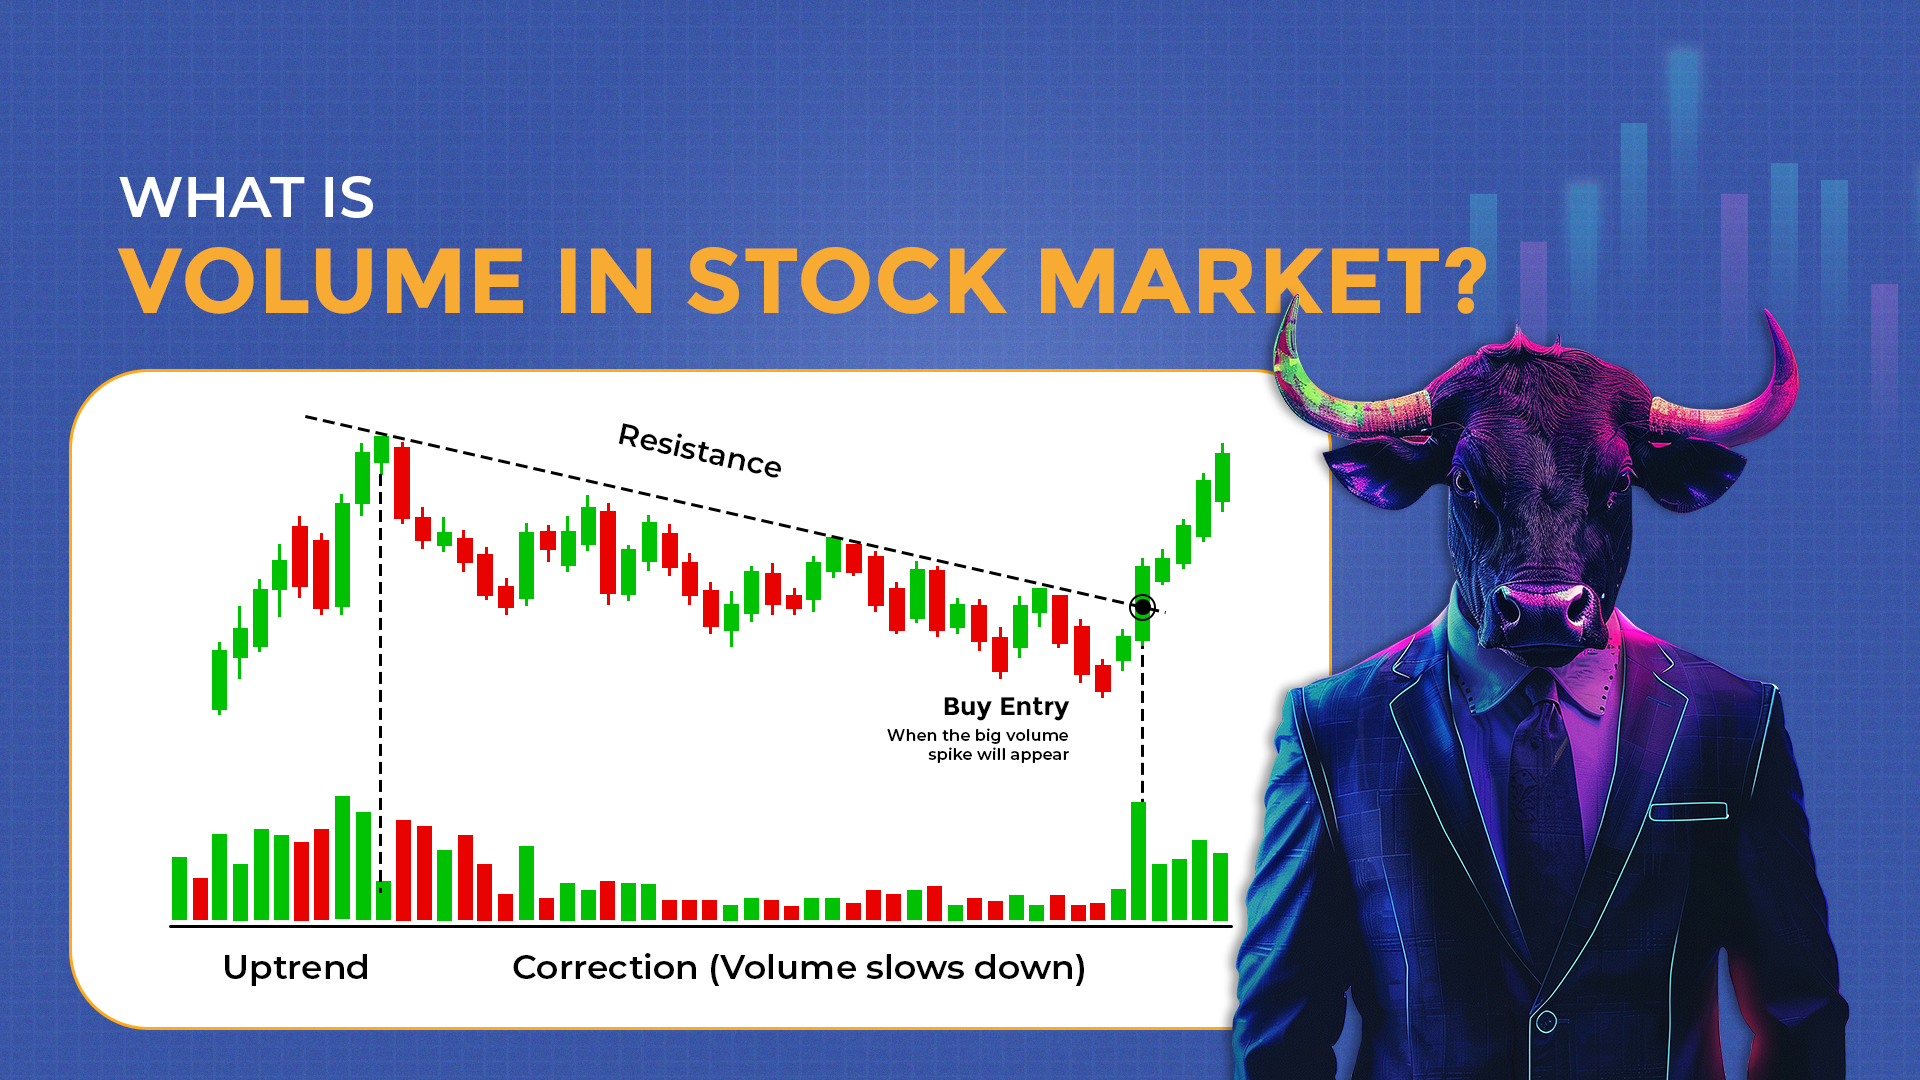
Breakouts happen when a stock price moves beyond a critical level, like a resistance or support line. For the breakout to be valid, it must be accompanied by high volume.
Combine it with other tools and techniques to make the best use of volume. Here are some simple ways to include volume in your trading strategy:
Resistance and support levels are key points on a stock chart where prices tend to reverse or break through.
For example:
Let's say stock A usually has a daily volume of 1,000,000 shares. One day, the price breaks its resistance level, and the volume is 2,500,000 shares. This shows strong buying interest, and the stock may keep rising.
Compare the current volume of a stock to its average volume over time.
To analyze volume more effectively, traders use tools called volume indicators. These are mathematical formulas that appear as charts. Let's explore two popular ones:
")
The OBV indicator adds the day's volume when the price closes higher and subtracts it when the price closes lower. It helps traders see whether money is flowing into or out of a stock.
")
The CMF indicator focuses on where the price closes in relation to its daily range (upper or lower) and the volume traded.
These indicators help confirm trends and provide insights into market strength.
When analyzing volume, here are some general rules to keep in mind:
By learning how to analyze volume, you can make better decisions in the stock market. It's not just about looking at prices but understanding the story behind them. Start practicing with essential charts and indicators, and over time, you'll master how to use volume effectively in your trading journey.